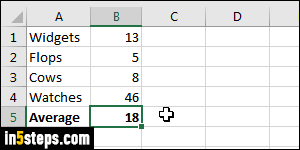
Another tutorial showed how to get the sum total of a series of numbers: Excel lets you just as easily calculate averages for numbers in a range of cells. And just like the addition, you don't even need to use a formula to see that average. But there is a formula to generate and display the average in a cell on your spreadsheet, and I'll show you how to do that as well! (Note: I'm using Excel 2016, but the steps are identical in Excel 2013 and Excel 2010.)
In 5 steps

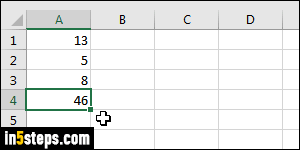
If you don't already have a worksheet with a series of numbers, type a few of them, one per cell. You can type them horizontally (one per cell, on the same row), or vertically (one per cell, same column). Excel handles both cases just fine. Make sure that your cells only contains numbers: no text allowed!

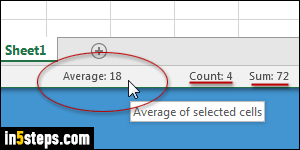
Now drag over the cells that contain your numbers, to select them. As you do, Excel updates its own set of numbers in the "status bar": that's the strip at the bottom of the window. By default, it shows the sum (total), the count (number of cells selected), and -drum roll- the average! You can show or hide stat numbers by right-clicking on the status bar, and checking them on or off in the menu.

You can calculate an average manually (add up all the numbers, and divide the result by the number of numbers you have!), but you don't need to. Go back to your list of numbers: select them all, plus select an additional, blank cell at the end, where you'll store that average (on the right, if you listed your numbers horizontally, or below that list otherwise). Click on the Formulas tab in the ribbon, and click on the arrow under AutoSum: now select Average!

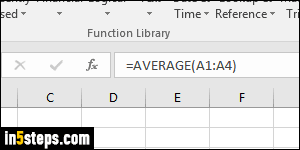
Behind-the-scenes, Excel used the well named "AVERAGE" formula. Look at the screenshot: you call the AVERAGE function, pass it the name of the start cell first, add a colon (":"), and then the last cell's name. (Tip: a cell's name come from the cell's column letter and its row number.) You can manually type this formula in a cell, but it's way easier to proceed as explained above!

